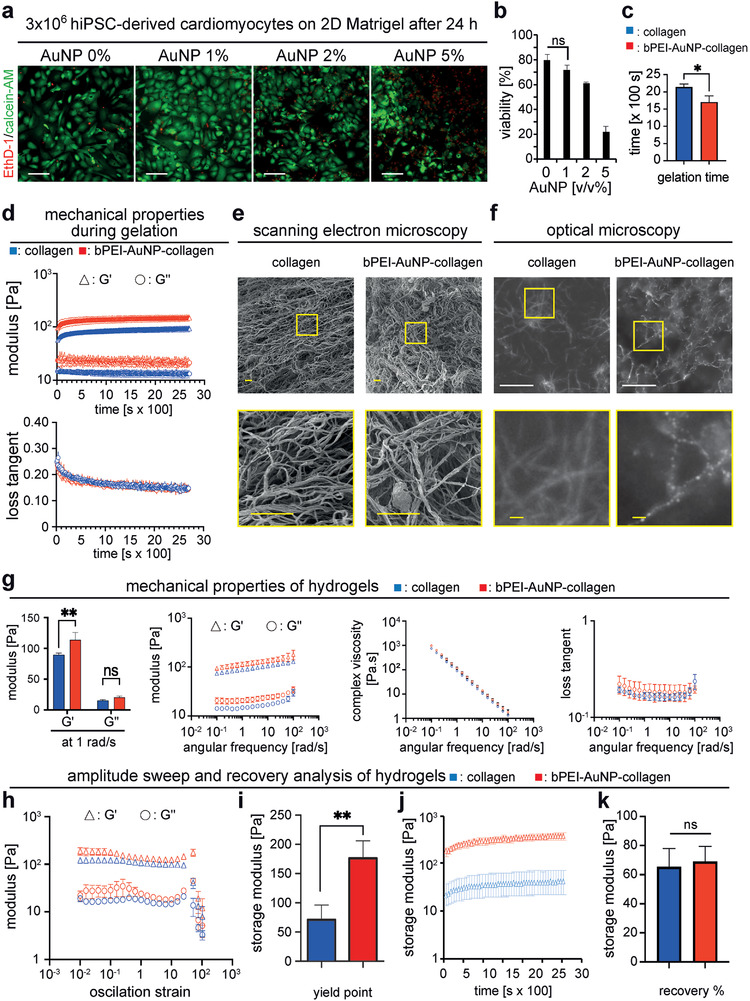
Figure 3.

Microstructure and mechanical properties of hydrogels. a) Representative images of hiPSC‐cardiomyocytes cultured on Matrigel for 24 h stained with calcein‐AM (green, living cells) and ethidium homodimer‐1 (EthD‐1, red, dead cells). b) Quantitative analysis of live and dead staining in (a) (n = 3, one‐way ANOVA and Bonferroni's multiple comparison test). c) Quantitative analysis of time to complete gelation of hydrogels performed based on time sweep test (n = 3, two‐tailed t‐test). d) Rheometric analysis of mechanical properties of hydrogels over time during the gelation process (n = 3). e) Representative scanning electron microscopy images of critically‐point dried hydrogels. f) Representative dark‐field optical microscopy images of hydrogels showing collagen fibers and gold nanoparticle–decorated collagen fibers. g) Quantitative post‐gelation rheometric analysis of hydrogels as a function of angular frequency (n = 3, G′ and G′ were compared based on two‐tailed t‐test). h,i) Quantitative rheometric amplitude sweep analysis for 0.01–100% deformation (n = 3) (h) and determination of yield point (i) (n = 3, two‐tailed t‐test). j) Analysis of hydrogel recovery after amplitude sweep test over time (n = 3) and k) quantitative analysis of hydrogel recovery at the end of experiment (n = 3, two‐tailed t‐test). Data are mean ± SD. Scale bars: yellow: 2 µm, white: 20 µm.
