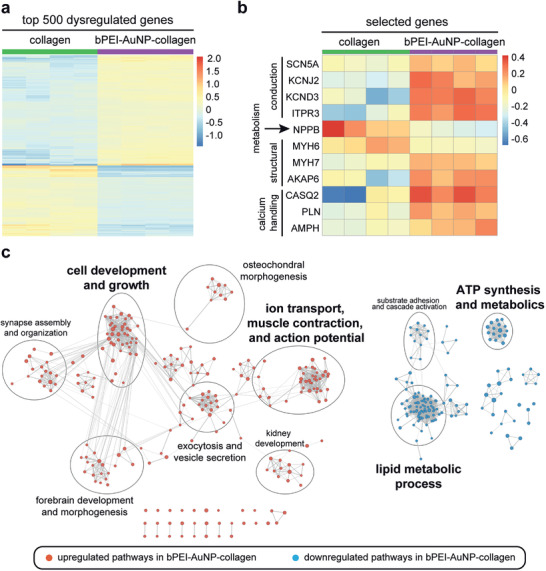
Figure 8.

RNA‐seq analyses identify marked expression differences between the collagen and bPEI‐AuNP‐collagen. a) Expression heatmap of the top 500 differentially expressed genes (adjusted p‐value < 0.01) between the bPEI‐AuNP‐collagen (n = 4) and the collagen groups (n = 4). b) Expression heatmap of selected differentially expressed genes (adjusted p‐value < 0.01). Heatmap colors represent expression values (red: up‐regulated; blue: down‐regulated in the bPEI‐AuNP‐collagen). Row/column dendrograms are not shown to increase visibility. c) Gene set enrichment analysis network. Nodes represent significantly dysregulated pathways (FDR < 0.01) and edges (lines connecting nodes) the similarity between two connected pathways based on the proportion of shared genes (measured via the overlap coefficient—OC). Node size is proportional to the number of leading edge genes associated with a given pathway and edge thickness to the OC. Circles identify pathway clusters, and a descriptive label is given for each cluster.
