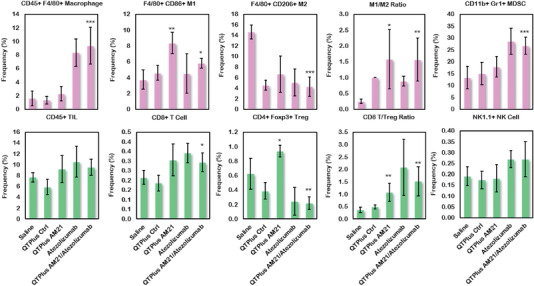
Figure 12.

Regulation of immune cell populations in tumor microenvironment from MC38 syngeneic mouse model after treatment of QTPlus AM21 and ATZ individually or in combination (n = 5). Student's t‐test was performed to determine the statistical differences in immunes cell populations between QTPlus‐AM21 or QTPlus‐AM21+ATZ versus saline group. *p < 0.05, **p < 0.01, ***p < 0.001.
