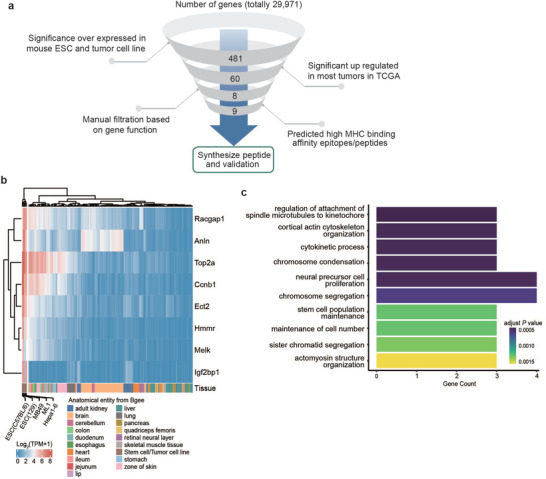
Figure 3.

Identification of cancer signature genes in ESCs. a) Illustration of the in silico filtration process. Genes highly expressed in ESC and tumor cell lines were further validated in TCGA expression data, manual filtration based on the gene function, and epitope‐MHC binding affinity prediction was then conducted, with candidate peptides then synthesized. b) Expression profiles of selected eight genes compared between mouse ESC and tumor cell lines to normal healthy tissues. c) Top ten significance enriched gene ontology function of the selected eight genes.
