Figure 1.

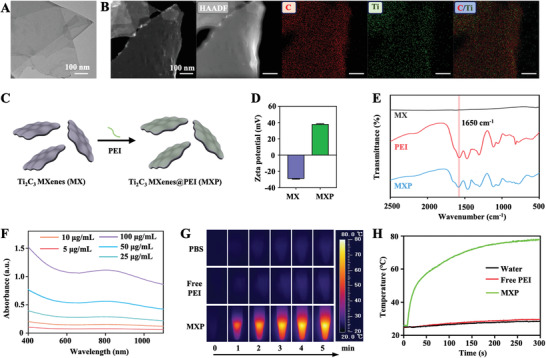
Characterization of MXP. A) TEM images of MX. B) High‐angle angular dark field‐scanning transmission electron microscopy (HAADF‐STEM) and EDX elemental mapping images of MX. Red and green indicate C and Ti elements, respectively. C) Schematic picture of the surface modification of MXP by PEI modification. D) Zeta potentials of MX and MXP. E) Fourier transform infrared (FT‐IR) spectra of MX, free PEI, and MXP dispersions. F) UV–vis spectra of the different concentrations of MXP. G) Thermal images at elevated MXP dispersion under NIR irradiation (808 nm, 1 W cm−2) and H) corresponding photothermal‐heating curves.
