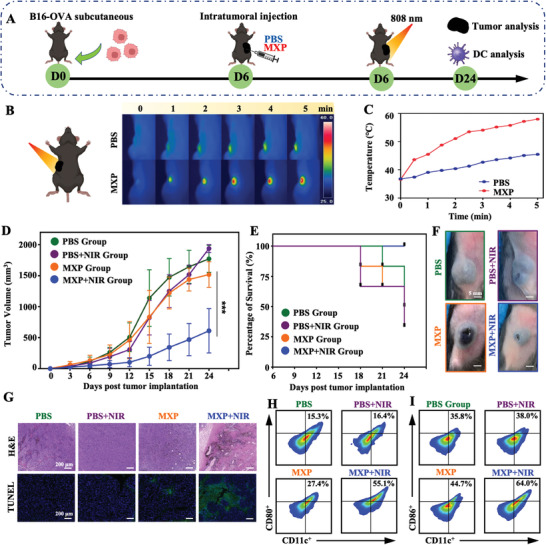
Figure 6.

In vivo antitumor experiments of MXP‐mediated PTT. A) Schematic illustration of the establishment of B16‐OVA tumor models and the treatment procedure. B) Temperature elevation in the tumor site after intratumoral injection of PBS or MXP under NIR light irradiation (808 nm, 1 W cm−2). C) Corresponding IR thermal images of the established tumor site. D) Average tumor growth curves of different groups (n = 6 independent mice per group). E) Survival rates after treatment. F) Photographs of B16‐OVA tumor‐bearing mice in different treatment groups. G) Histological microscopy images of tumors after different treatments. H,I) Representative FCM plots of H) CD11c+CD80+ cells and I) CD11c+CD86+ cells in tumor tissues of different groups.
