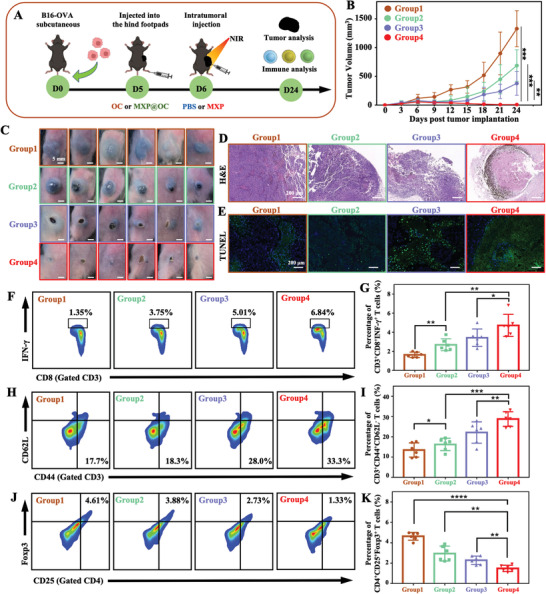
Figure 7.

Combining MXP@OC nanovaccine with MXP‐mediated PTT. A) Schematic illustration of the establishment of B16‐OVA tumor models that were then immunized with OC or MXP@OC and treated with MXP combined with NIR light irradiation (808 nm, 1 W cm−2, 5 min, n = 6/group). B) Average tumor growth curves (n = 6 independent mice per group). (Group 1: OC; Group 2: MXP@OC; Group 3: MXP+NIR+OC; Group 4: MXP+NIR+MXP@OC). C) Photographs of B16‐OVA tumor‐bearing mice in the four groups. D) H&E and E) TUNEL staining images of stripped tumors after different treatments. F) Representative FCM plots and G) statistical analysis and the percentages of CD3+CD8+IFN‐γ + T cells. H) Representative FCM plots and I) percentages of CD3+CD44+CD62L− effector memory T cells in tumor tissues. J) Representative FCM plots and K) percentages of CD4+CD25+Foxp3+ Tregs in tumor tissues. For statistical significance, *P<0.05; **P<0.01;
