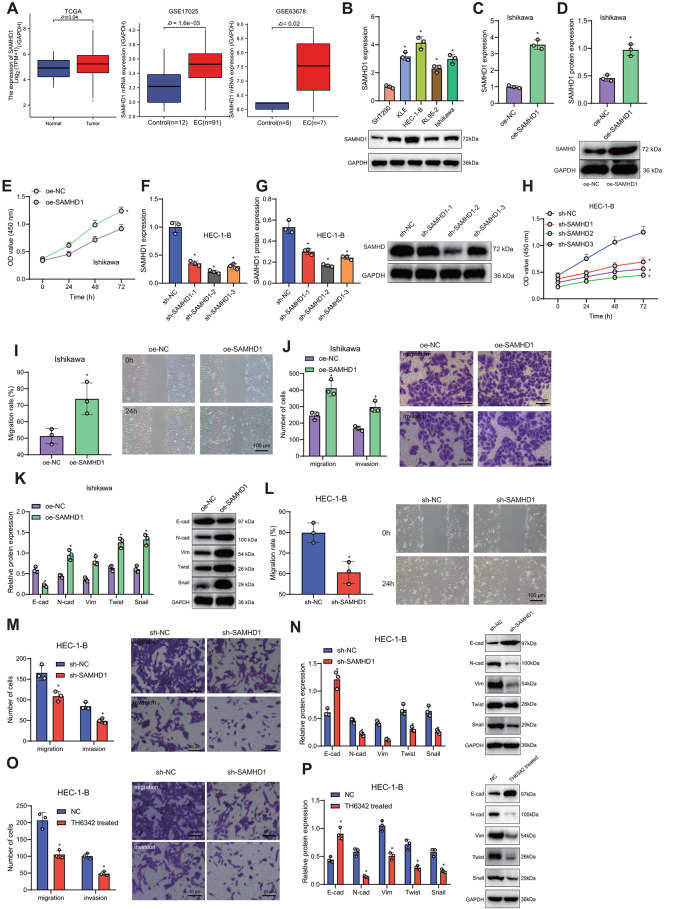
Fig. 1.
The effects of overexpression or silence of SAMHD1 on the proliferation, migration, and invasion abilities of endometrial cancer cells Note (A) In the TCGA, GSE17025, and GSE63678 datasets, the expression of SAMHD1 in endometrial cancer samples, ovarian cancer, and SAMHD1 expression in cancer-adjacent samples was examined. The TCGA and GSE17025 data were both normalized using TPM, while the GSE63678 data was normalized using FPKM; (B) Western blot detection of SAMHD1 expression in different endometrial cancer cell lines; (C) qRT-PCR detection of the efficiency of SAMHD1 overexpression; (D) Western blot detection of SAMHD1 expression in stable SAMHD1 overexpressing endometrial cancer cell lines; (E) CCK8 assay to assess the proliferation capacity of SAMHD1 overexpressing cell lines; (F) qRT-PCR detection of the efficiency of SAMHD1 knockdown; (G) Western blot detection of SAMHD1 expression in stable SAMHD1 knockdown endometrial cancer cell lines; (H) CCK8 assay to assess the proliferation capacity of SAMHD1 knockdown cells; (I) Scratch assay to assess the migration ability of Ishikawa cell line overexpressing SAMHD1; (J) Transwell assay to assess the invasion ability of Ishikawa cell line overexpressing SAMHD1; (K) Western blot detection of EMT-related proteins; (L) Scratch assay to assess the migration ability of SAMHD1 knockdown cells; (M) Transwell assay to assess the invasion ability of SAMHD1 knockdown cells (50 µm); (N) Western blot detection of EMT-related proteins; (O) Migration and invasion assay of HEC-1-B cells treated with SAMHD1 inhibitor TH6342; (P) Western blot analysis of EMT-related proteins (N-cadherin, Vimentin, Twist, Snail, E-cadherin) in TH6342-treated HEC-1-B cells. (The statistical analysis employed mean ± standard deviation representation. For comparing two groups, an independent samples t-test was used, while one-way ANOVA was utilized for comparing three or more groups. Data from different time points were analyzed using two-way ANOVA. ‘*’ indicates statistical significance compared to the oe-NC or sh-NC group, where P < 0.05 signifies a significant difference. The experiments were repeated three times.)

