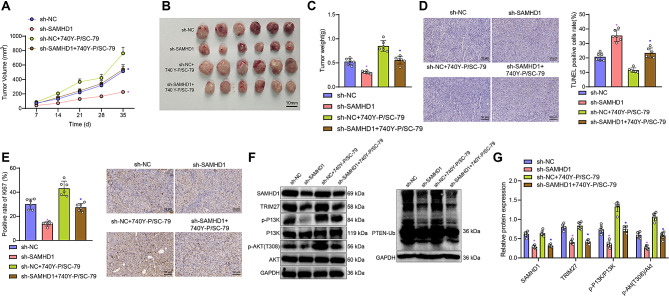
Fig. 7.
SAMHD1 knockout inhibits tumor progression by suppressing the PTEN/PI3K/AKT pathway Note (A) Tumor growth curve of HEC-1-B tumor-bearing mice; (B) Tumor size; (C) Tumor weight statistics; (D) Tunel staining for apoptosis level in tumor tissue (scale bar = 50 μm); (E) Ki67 staining for proliferation level in tumor tissue (scale bar = 50 μm); (F-G) Western blot for expression of tumor-related proteins in tumor tissue. N = 6. For multiple group data, one-way analysis of variance was conducted, with pairwise comparisons between groups analyzed using Tukey’s test. Tumor volume data at different time points were analyzed using repeated measures analysis of variance. (* in purple indicates comparison with shNC, p < 0.05; * in blue indicates comparison with shSAMHD1, p < 0.05)

