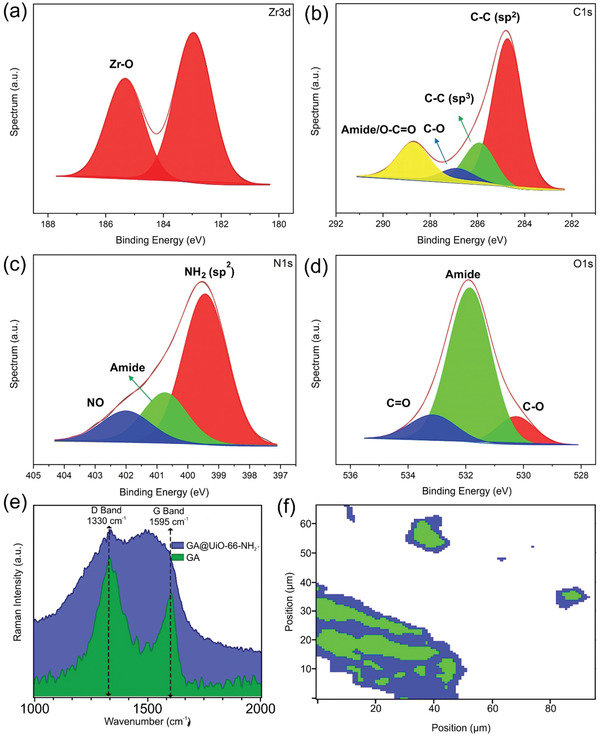
Figure 2.

High‐resolution XPS spectra of GA@UiO‐66‐NH2 a) Zr 3d, b) C1s, c) N1s, and d) O1s; e) Raman spectra of pristine GA and GA@UiO‐66‐NH2; f) Raman Map obtained by a hierarchical cluster analysis of the Raman image of GA@UiO‐66‐NH2, blue corresponding to the D band and green corresponding to amide bond.
