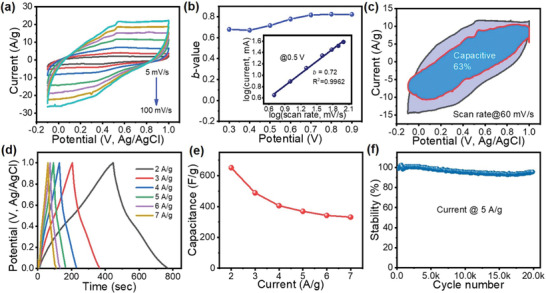
Figure 4.

Electrochemical performance of a GA@UiO‐66‐NH2 electrode in a three‐electrode configuration: a) cyclic voltammetry curves recorded at different scan rates in 1 m Na2SO4 electrolyte. b) Variation of b‐values with anodic potential scan. Inset shows power law dependence of peak current density at 0.5 V (versus Ag/AgCl). c) Voltammetry response at a scan rate of 60 mV s−1. The capacitive contribution to the total current is shown by the shaded region (63% of total charge contribution). d) Galvanostatic charge/discharge curves measured at different current densities. e) Variation of specific capacitance as a function of current density. f) Long‐term cycling stability measured at 5 A g−1 over 20 000 cycles.
