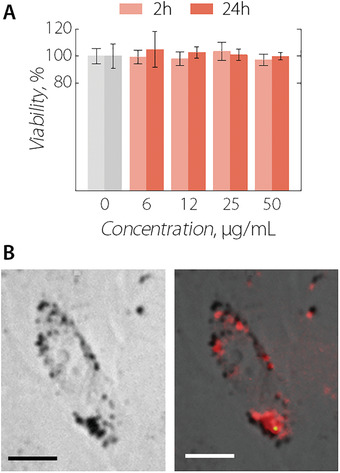
Figure 2.

A) MCF‐7 cell viability after incubation with NIR‐MNCs at different extracellular concentrations. B) Optical (left) and NIR‐II fluorescence (right) images of a single MCF‐7 cancer cell after being incubated for 4 h with NIR‐MNCs at a concentration of 50 µg mL−1. The fluorescence image was obtained under broadband excitation (500–900 nm) and emission (1000–1500 nm). Scale bars in (B) are 5 µm.
