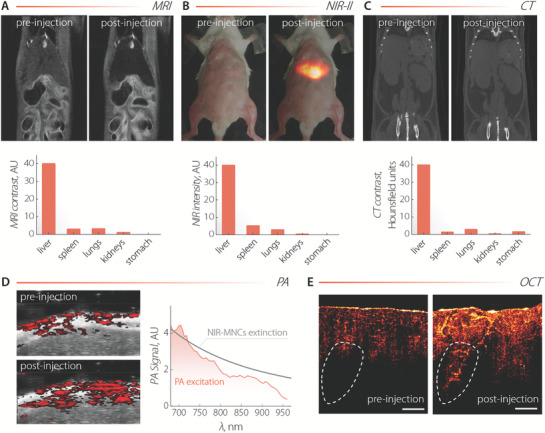
Figure 3.

A) MRI, B) NIR‐II, and C) CT images of mice before and 30 min after administration of a dispersion of NIR‐MNCs (2 mg mL−1). 200 µL, 100 µL, and 300 µL of NIR‐MNCs dispersion were administered to each mouse, respectively. The biodistribution pattern obtained from each technique is also included. For MRI and CT, the patterns were obtained from in vivo images and the reported values are the product between the average contrast value for each organ obtained from image analysis and the weight of the organ. For NIR‐II imaging (λex = 800 nm), the overall intensity from the different organs harvested after imaging (36 min in total; 30 min after injection + 6 min of imaging) was plotted. D) PA images of the liver (overlapped with ultrasound images) as obtained before and after intravenous (i.v.) injection of NIR‐MNCs (100 µL, 1.5 mg mL−1). λex = 750 nm. The PA signal generated at the liver as a function of the excitation wavelength is also included (orange line), along with the absorption spectrum of NIR‐MNCs (gray line). E) OCT images of chicken breast tissue before and after injection of NIR‐MNCs (100 µL, 1.5 mg mL−1). The diffusion of NIR‐MNCs into the tissue makes possible the visualization of internal structures such as the vessel in the contoured areas. The scale bar is 1 mm.
