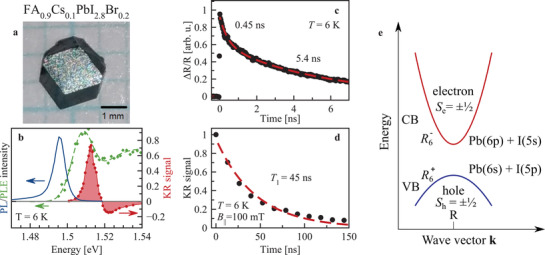
Figure 1.

Exciton recombination and spin relaxation dynamics in FA0.9Cs0.1PbI2.8Br0.2. a) Microscopy image of FA0.9Cs0.1PbI2.8Br0.2 crystal. b) Spectra of photoluminescence (blue) excited at 1.96 eV and photoluminescence excitation (green), as well as of TRKR amplitude at zero time delay (red). c) Differential reflectivity dynamics ΔR/R (dots) and fitted with bi‐exponential function (line). d) Dynamics of KR amplitude (dots) with mono‐exponential fit (line) at B || = 100 mT. The dynamics in (c,d) are measured with the laser photon energy of 1.513 eV. e) Sketch of direct bandgap at the R point of the Brillouin zone. Valence band is formed by 6s‐type lead orbitals strongly hybridized with iodine 5p‐type orbitals, conduction band is formed by 6p‐type lead orbitals with minor admixture of 5s iodine orbitals. Nomenclature follows ref. [41] and S e,h here denotes the component of the angular momentum of the Bloch function.
