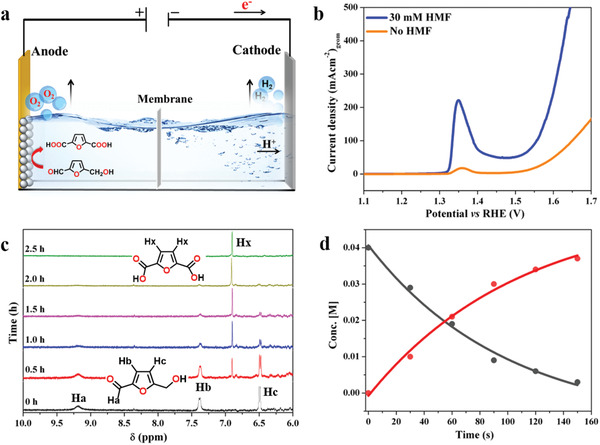
Figure 5.

Electrocatalytic oxygenation reaction of HMF to FDCA. a) Fabrication of two‐electrode cell for electrocatalytic oxygenation reaction. b) LSV curves of LiMnBPO/NF in aqueous 1 m KOH solution without HMF (orange) and with 30 × 10−3 m HMF (blue). c) 1H NMR spectra of the reaction solution under electrolysis. The black spectrum (0 h) at the bottom of the panel represents the solution before electrolysis displaying three resonance signals for the HMF while the green spectrum (2.5 h) at the top of the panel consisted of only one proton resonance at 6.8 ppm demonstrating the complete conversion of HMF to FDCA. d) Plot of concentration of HMF and FDCA versus time (in CA conditions). The concentration of the HMF and FDCA was determined from the relative intensities of the proton resonances of HMF and FDCA in 1H NMR. Concentration of HMF (black circles) slowly decreasing, while FDCA (red circles) increasing with time. The fitting of the data points gives rise to a single exponential equation (y = y 0 + A 0 exp(k obs t) and R 2 = 0.99; k obs is the observed rate constant) indicating the electrooxidation, and FDCA formation follows a pseudo‐first reaction kinetics.
