Figure 3.

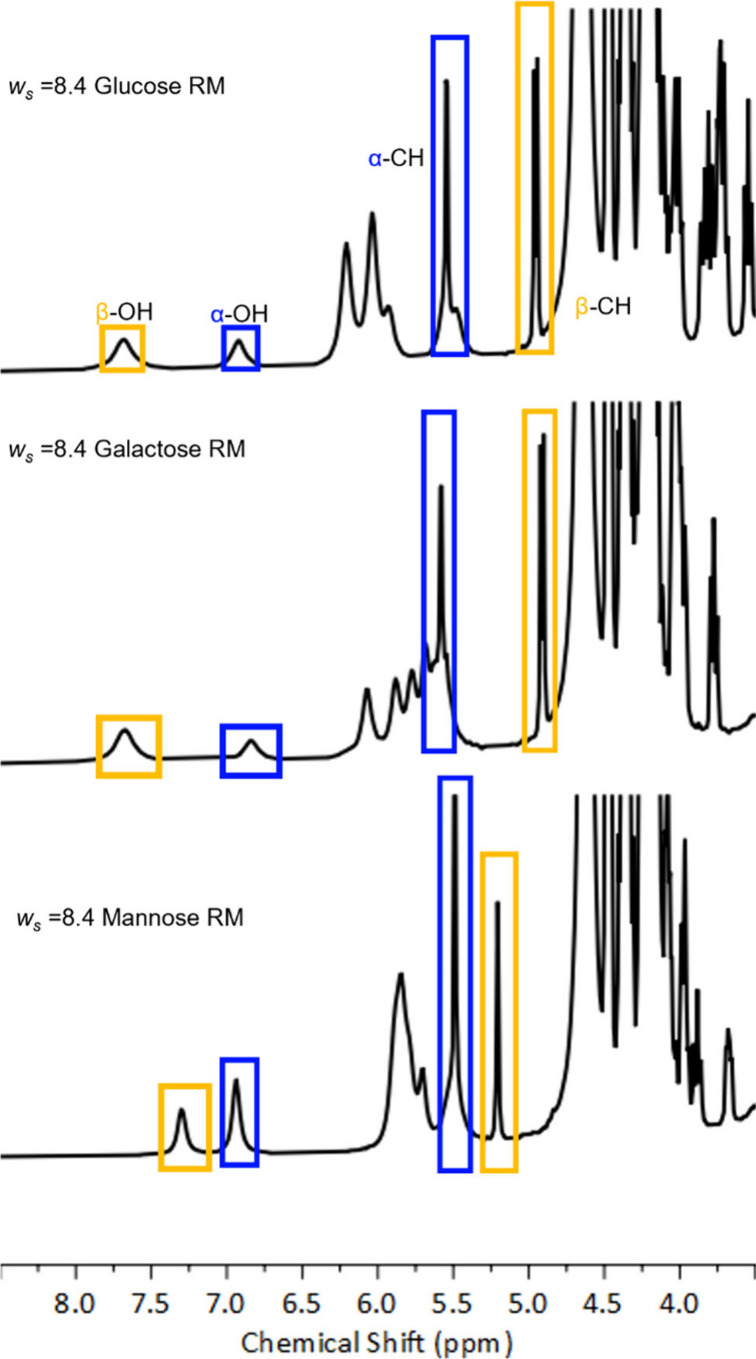
1H NMR spectra of AOT reverse micelles with ws = 8.4 encapsulating glucose (top), galactose (middle), and mannose (bottom). Blue and gold boxes identify signals from α and β peaks, respectively.

1H NMR spectra of AOT reverse micelles with ws = 8.4 encapsulating glucose (top), galactose (middle), and mannose (bottom). Blue and gold boxes identify signals from α and β peaks, respectively.