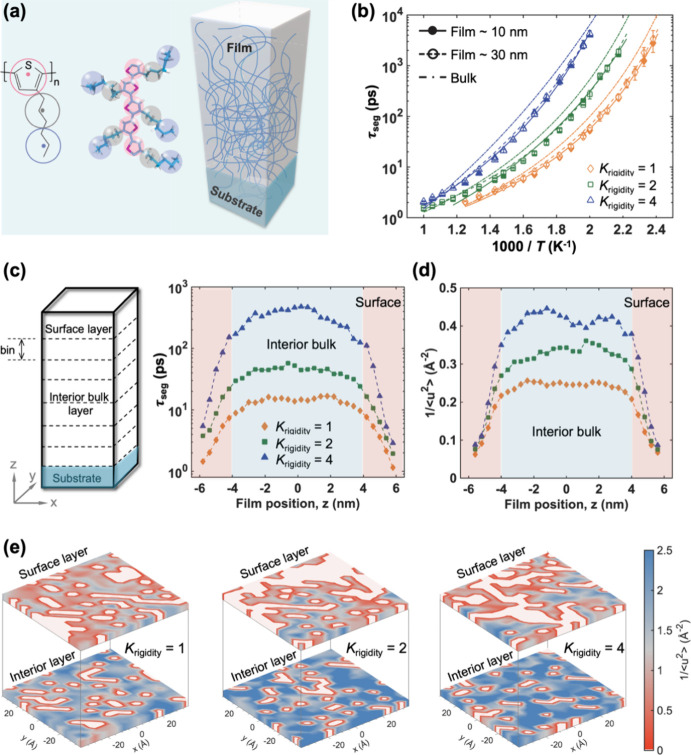
Figure 2.
(a) The mapping scheme from all-atomistic model to the three-bead per monomer coarse-grained model for P3HT (left); schematic illustration of polymer thin film (right). (b) T-dependent segmental relaxation time τseg for 10 nm- and 30 nm-thick films comparing with the bulk system at various Krigidity values. The solid and dashed curves represent the VFT fits of the τseg data. (c) The distribution of local τseg as a function of film position z for different Krigidity values. (d) Distribution of local molecular stiffness 1/⟨u2⟩ as a function of film position z for different Krigidity values. (e) Color maps of the 1/⟨u2⟩ for the interior layer and surface layer with varying Krigidity. The red domains correspond to lower local stiffness or higher local mobility, while blue domains correspond to higher local stiffness or lower local mobility. The color map scale is the same for all images (color online).

