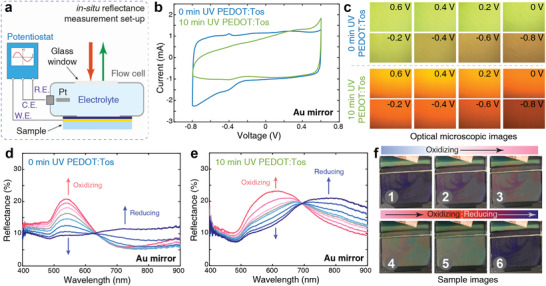
Figure 5.

Electrochemical tuning of UV‐patterned PEDOT structural color devices. a) Schematic of the flow cell used for electrochemical measurements. R.E. is reference electrode, C.E. is counter electrode, and W.E. is working electrode. b) Cyclic voltammetry of UV patterned PEDOT:Tos films on 100 nm Au mirrors (0 and 10 min UV exposure). The scan rate was 100 mV s−1. c) Optical microscopy images of UV‐patterned PEDOT devices at different electrochemical bias (top: 0 min UV‐treated PEDOT, and bottom: 10 min UV‐treated PEDOT). d,e) In situ electrochemical tuning of the reflectance of 0 min UV‐treated PEDOT (d) and 10 min UV‐treated PEDOT (e) devices. The blue curves indicate negative bias (reducing the polymer) and the red curves indicate positive bias (oxidizing the polymer). The intensity of red and blue colors represents the increase in positive and negative electrochemical bias indicated by the arrows. The gray color curves indicate the zero electrochemical bias. f) Electrochemical tuning of a device with a 10 min UV‐patterned image (VPP time of 30 min).
