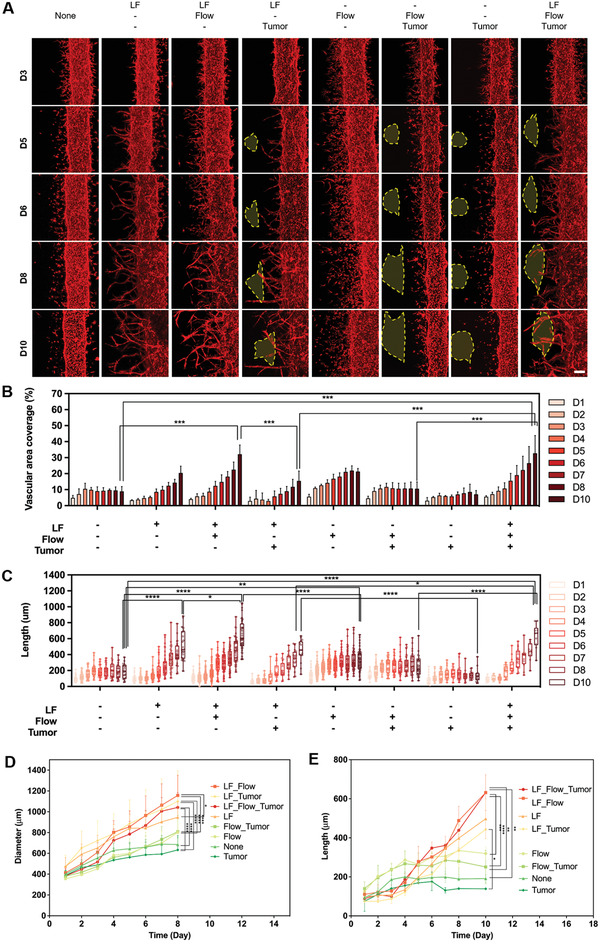
Figure 3.

Screening efficient angiogenesis conditions depending on the combination of three experimental factors: flow, hLFs, and tumor. A) Growth of blood vessels depending on the presence or absence of fibroblasts, flow, and tumor spheroids. Scale bar: 200 µm. Yellow dotted line denotes tumor spheroids. B) Quantification of vascular area coverage depending on the combination of the three experimental factors (***p < 0.001). C,D) Growth rate of microvascular length depending on the combination of the three experimental factors (*p < 0.05, **p < 0.01, ***p < 0.001, and ****p < 0.0001). E) Changes in the diameter depending on the combination of the three experimental factors (*p < 0.05, **p < 0.01, ***p < 0.001, and ****p < 0.0001).
