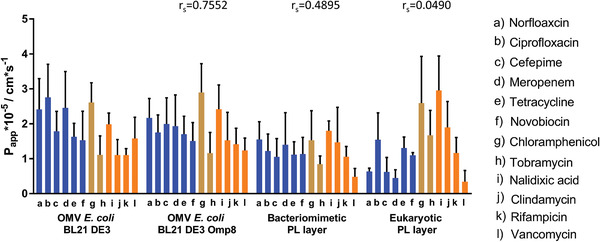
Figure 11.

Apparent permeability coefficients (P app) of eleven antibiotics on four vesicle‐derived membrane models. Antibiotics with expected porin‐facilitated pathway[ 32 , 63 , 64 , 65 , 66 , 67 ] are depicted in blue, while antibiotics with predominantly porin‐independent pathways are depicted in orange.[ 7 , 15 , 68 , 69 , 70 ] Antibiotics with various pathways are light brown columns.[ 32 , 67 , 70 , 71 ] Columns represent mean + SD. N ≥ 9 from at least 3 independent experiments. A two‐way ANOVA was performed with Tukey's multiple comparisons post‐hoc analysis (Section S2, Supporting Information).
