
Figure 4.
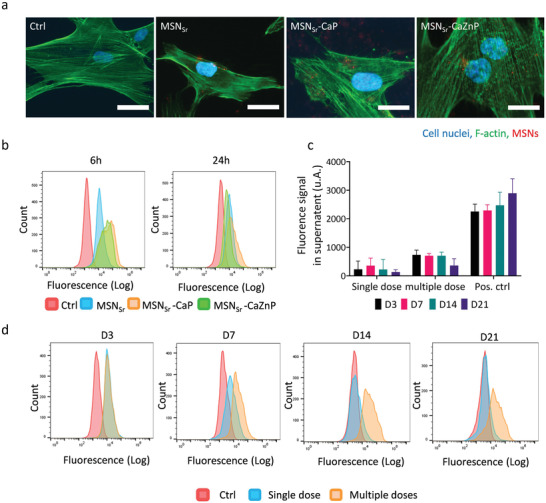
MSN internalization in hMSCs. a) Fluorescence microscopy images of hMSCs exposed to MSNSr, MSNSr‐CaP, and MSNSr‐CaZnP at 140 µg mL−1 for 6 h. Cells stained for nuclei (DAPI; blue) and actin (phalloidin 488; green). MSNs are shown in red. Scale bars are 50 µm. b) Flow cytometry histograms of hMSCs exposed to MSNSr, MSNSr‐CaP, and MSNSr‐CaZnP at 140 µg mL−1 for 6 and 24 h. c) Fluorescence intensity of labeled MSNSr‐CaZnP in supernatant after 3, 7, 14, and 21 days of culture measured by a microplate reader. Positive control (Pos. ctrl) is cell culture media with 140 µg mL−1 labeled MSNSr‐CaZnP. d) Flow cytometry histograms of MSNSr‐CaZnP uptake, by hMSCs exposed to single dose and multiple doses after 3, 7, 14, and 21 days of cell culture.