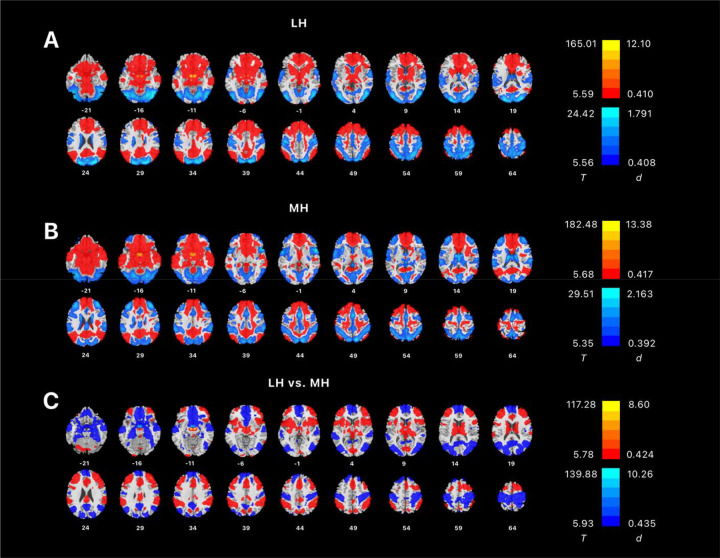
Figure 1:
Whole-brain resting-state connectivity of (A) LH and (B) MH shown in one-sample t-tests, evaluated at voxel p < 0.05 corrected for family-wise error (FWE). Warm and cool color each shows positive and negative rsFC. (C) showed paired t-test of LH vs. MH rsFCs, evaluated at voxel p < 0.05, FWE corrected. Color bars show voxel T value and Cohen’s d. Warm/cool color: in (A) and (B) positive/negative resting state functional connectivity, and in (C), positive/negative differences in resting state functional connectivity between LH and MH.

