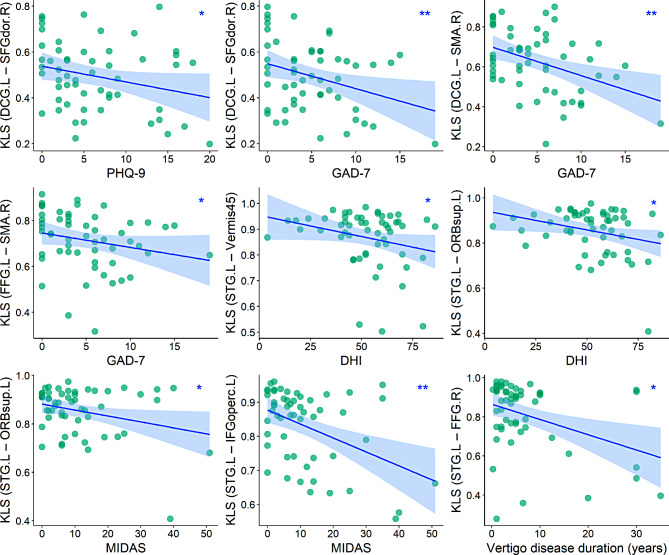
Fig. 5.
Clinical correlates of significant GM connectome features in the VM group. Scatter plots depict the relationship between clinical indices and GM connectome features with between-group differences in patients with VM (∗P < 0.05, ∗∗P < 0.01). Several connections in the identified connected component were correlated with clinical measures (P < 0.05); however, these correlations did not survive FDR correction (PFDR > 0.05) or Bonferroni correction (Bonferroni-corrected P > 0.05) for multiple comparisons. Sex, age, and education level were controlled as covariates of no interest. GM = gray matter; VM = vestibular migraine; FDR = false discovery rate; KLS = Kullback–Leibler divergence-based similarity; DCG = median cingulate and paracingulate gyri; SFGdor = superior frontal gyrus, dorsolateral; SMA = supplementary motor area; FFG = fusiform gyrus; STG = superior temporal gyrus; Vermis45 = lobule IV, V of vermis; ORBsup = superior frontal gyrus, orbital part; IFGoperc = inferior frontal gyrus, opercular part; L = left; R = right; PHQ-9 = Patient Health Questionnaire-9; GAD-7 = Generalized Anxiety Disorder-7; DHI = Dizziness Handicap Inventory; MIDAS = Migraine Disability Assessment Scale

