Figure 3.

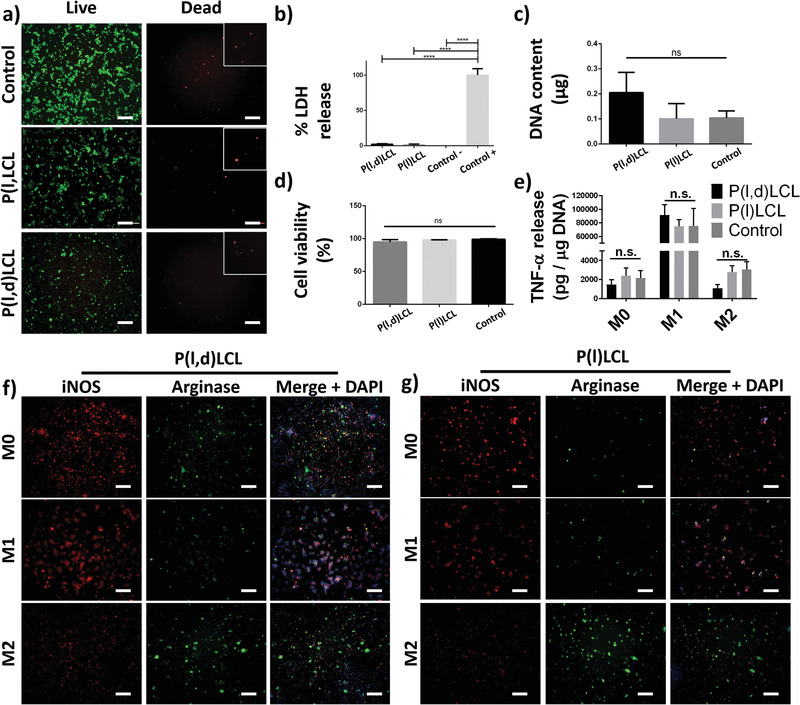
Biocompatibility of P(l)LCL and P(l,d)LCL substrates. a) Fluorescence microscopy images of macrophages cultured on P(l)LCL, P(l,d)LCl, and control TCP substrates and stained for calcein (green, live) and ethidium homodimer (red, death). Scale bar is 200 µm. Insets show higher magnification details of dead cells. Inset size is 120 × 120 µm. b) Percentage of released LDH by macrophages cultured on the copolymer substrates normalized with positive and negative controls of cells cultured on TCP. c) DNA content calculated from cells adhered in the different substrates 48 h after seeding. d) Percentage of viable cells calculated from images in (a). e) Quantification of released TNF‐α per µg of DNA by macrophages cultured on the different substrates in non‐stimulated (M0), M1 (LPS 10 + IFN‐ɣ), and M2 (IL‐13 + IL‐4) stimulated conditions. f,g) Fluorescence microscopy images of macrophages in the different states of stimulation presented in (e) and stained for iNOS (red, M1), arginase (green, M2), and DAPI (nucleus, DNA, blue). Scale bar is 200 µm. Statistical significance was calculated from one‐way ANOVA with Tukey's multiple comparison test. n = 3 for all experiments. Adjusted p‐values (****) p < 0.0001, (***) p < 0.001, (**) p < 0.01, and (*) p < 0.1.
