
Figure 7.
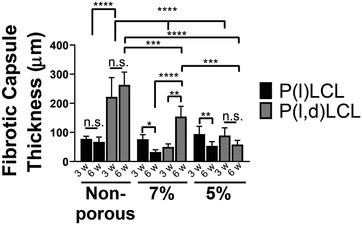
Evolution of the thickness of the formed fibrotic capsule in implanted P(l)LCL and P(l,d)LCL scaffolds after 3 and 6 weeks of implantation. Data are shown as mean ± standard deviation. w denotes weeks. Statistical significance was calculated from two‐way ANOVA with Tukey's multiple comparison test. Five measurements were taken in every sample, n = 4. Interaction F(6,33) = 4.14, p = 0.003; material type F(2,33) = 10.8, p = 0.0002; porosity F(3,33) = 11.99, p < 0.0001. Adjusted p‐values: (****) p < 0.0001, (***) p < 0.001, (**) p < 0.01, and (*) p < 0.1.