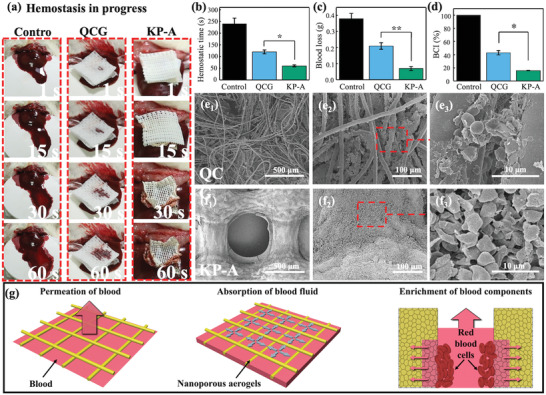
Figure 4.

In vivo animal experiments with the rat liver laceration model. a) Images of hemostasis in progress. First column is the natural hemostasis as the control, second and third column correspond to results applying QCG and KNF‐PVA aerogel (KP‐A) gauze. Comparison of b) hemostatic time, c) total blood loss, and d) blood clotting index (BCI) between natural hemostasis and hemostatic materials QCG and aerogel gauze. SEM images and zoomed‐in details of accumulated blood cells on the surface of e) QCG and f) KP‐A gauze. g) Proposed hemostatic mechanism of KP‐A gauze. Data in (b–d) was shown with mean values and standard deviation. The number of experiments in each group is 3 (n = 3). One‐way analysis of variance (ANOVA) by SPSS software (IBM) was applied for statistical analysis. *p < 0.05 and **p < 0.01 were considered significant and greatly significant difference.
