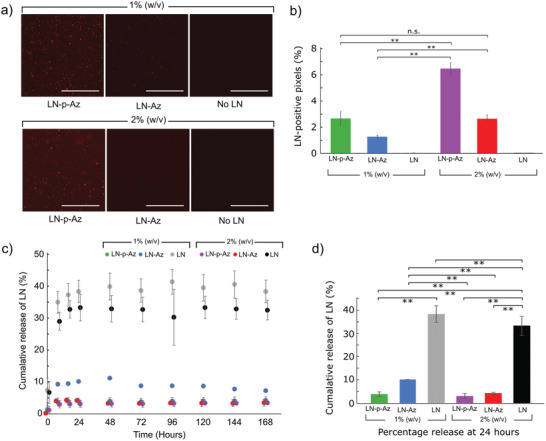
Figure 2.

a) Fluorescence images of the Cy3‐labeled LN‐(p)‐Az conjugated in the HA:PEG hydrogels. Scale bars: 100 µm. b) LN‐positive pixels determined from fluorescence images of the hydrogels, N = 4 for each condition, n.s. = not significant (p > 0.05). c) Cumulative release of unbound LN, LN‐p‐Az, and LN‐Az from hydrogels with 1% and 2% (w/v) for 7 days, N = 6. d) Percentage release at 24 h showing statistical significance pairings where ** = p < 0.01 using ANOVA followed by Tukey's HSD. All error bars are standard deviation.
