
Figure 6.
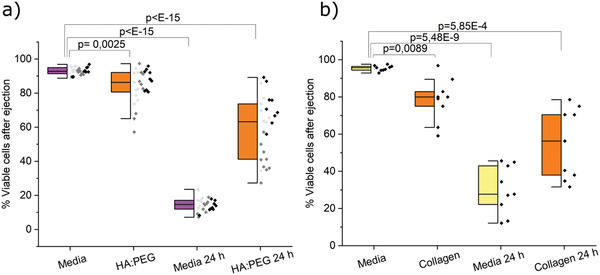
a) Survival of ejected predifferentiated lt‐NES in HA:PEG and cell media immediately after ejection and after 24 h measured with Live/Dead assay. Data were collected from three individual experiments (indicated with different shades of gray), N = 27, where N represents one replicate of ejected cells. Outliers were removed by a Grubbs Test, and p‐values were derived using LMM in Origin Pro. Data are presented both as a box indicating the 25th–75th percentile with a median line and ±1.5 IQR whiskers, and as individual data points. b) Survival of ejected predifferentiated lt‐NES in collagen and cell media. Data were collected from one individual experiment, N = 9, where N represents one ejected replicate. No data were excluded. p‐values were derived using LMM in Origin Pro.