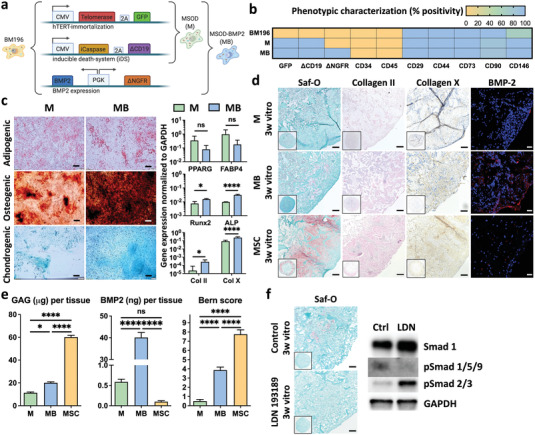
Figure 1.

Engineering of a human mesenchymal cell line with robust chondrogenic capacity. a) Generation of mesenchymal cell lines by genetic engineering of primary human bone marrow derived mesenchymal stromal cells (hBM‐MSCs) from a single donor (BM196). Immortalization and death‐inducibility was conferred by human telomerase reverse transcriptase (hTERT) and inducible caspase 9 (iCaspase) expression respectively, leading to the MSOD (M) line. The MSOD‐B (MB) cell line resulted from the subsequent implementation of constitutive bone morphogenetic protein‐2 (BMP‐2) expression. b) The M and MB lines maintain a mesenchymal stromal phenotype when compared to their primary hBM‐MSC counterpart (BM196). c) The MB line displays in standard 2D assays an increased osteogenic and chondrogenic differentiation capacity as compared to the M line (scale bar = 200 µm) (n ≥ 3). Oil‐Red‐O, Alizarin red, and Alcian blue stainings were used, respectively, for adipogenesis, osteogenesis, and chondrogenesis. Gene expression was assessed after 2 (osteogenic) or 3 weeks (adipogenic and chondrogenic) of in vitro differentiation. The graphs represent mean + standard deviation (SD), **p ≤ 0.01, ***p ≤ 0.001, determined by two‐tailed unpaired t‐test. d) The BMP‐2 overexpression confers robust in vitro chondrogenic capacity in MB cells, leading to the formation of hypertrophic cartilage (positively stained for Safranin‐O and for Collagen types II and X), enriched in BMP‐2. In contrast, M cells are not chondrogenic. As a positive control, primary hBM‐MSCs from selected chondrogenic batches (here MSC) form mature cartilage exhibiting a limited BMP‐2 presence (scale bars = 100 µm). e) Quantitative assessments of glycosamynoglycans (GAG), BMP‐2, and Bern scoring (see ref. [ 29 ]) confirming the formation of frank cartilage by MB cells, with a net BMP‐2 enrichment remaining within physiologic ranges. MSC = highly chondrogenic hBM‐MSC batches. f) The MB chondrogenic capacity is critically dependent on the BMP‐2 Smad1/5/9 signaling pathway, since its targeted inhibition by LDN193189 molecule, despite maintenance of the TGFβ‐Smad 2/3 activation, prevents the formation of cartilage (Saf‐O staining). Phosphorylated Smad: pSmad. Scale bars = 100 µm (n = 3). The graphs represent mean + SD, *p ≤ 0.05, ****p ≤ 0.0001 determined by analysis of variance (ANOVA) test.
