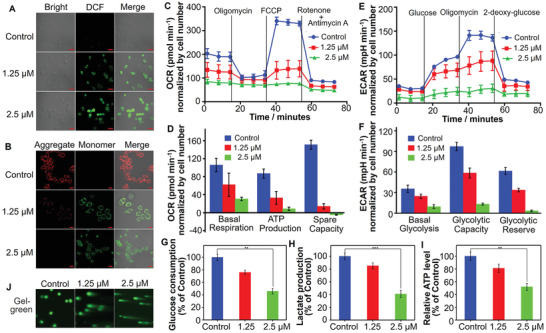
Figure 3.

A) DCFH‐DA detection of ROS in MDA‐MB‐231/Adr cells after incubation with RuZ for 24 h. λex/em = 485/530 nm. Scale bar: 20 µm. B) JC‐1 detection of mitochondrial dysfunction in MDA‐MB‐231/Adr cells incubated with RuZ for 24 h (λex = 485 nm, λem/green = 530 nm, λem/red = 590 nm). Scale bar: 20 µm. C) Cellular oxygen consumption in MDA‐MB‐231/Adr cells was detected at 24 h after treatment with RuZ by Seahorse analyzer. Oligomycin (1.5 × 10⁻⁶ m) was added after 15 min, carbonyl cyanide‐p‐trifluoromethoxyphenylhydrazone (FCCP) (2.0 × 10⁻⁶ m) was added after 33 min, and rotenone/antimycin A (0.5 × 10⁻⁶ m) was added after 54 min (n = 4, mean ± SD). D) Quantitative comparison of basal respiration, ATP production, and respiratory capacity from (C). E) ECAR was determined in MDA‐MB‐231/Adr cells at 24 h after incubation with RuZ. Glucose (10 × 10−3 m) was added after 15 min, oligomycin (1.5 × 10⁻⁶ m) was added after 33 min and 2‐deoxy‐glucose (50 × 10−3 m) was added after 54 min (n = 4, mean ± SD). F) Quantitative comparison of basal glycolysis, glycolytic capacity, and glycolytic reserve from (E). G) Glucose consumption over 24 h of incubation with RuZ. (n = 4, mean ± SD). *p < 0.05. H) Intracellular lactate production and I) ATP level over 24 h of incubation with RuZ. (n = 4, mean ± SD. *p < 0.05. J) Comet assay showing RuZ induced DNA strand breaks in MDA‐MB‐231/Adr cells (λex = 488 nm).
