Figure 8.

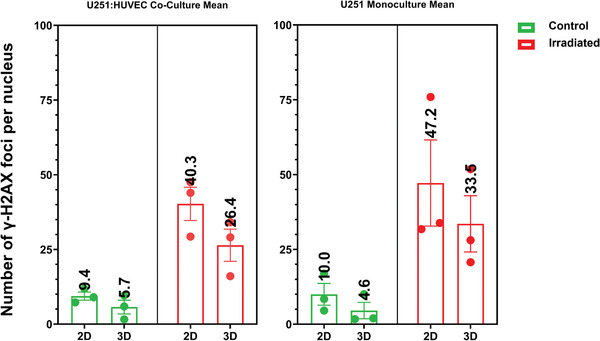
Mean values of the experiments reported in Figure 7. The mean values are higher for irradiated samples. The values for monoculture samples are ≈20% higher than for co‐culture samples.

Mean values of the experiments reported in Figure 7. The mean values are higher for irradiated samples. The values for monoculture samples are ≈20% higher than for co‐culture samples.