
Figure 1.
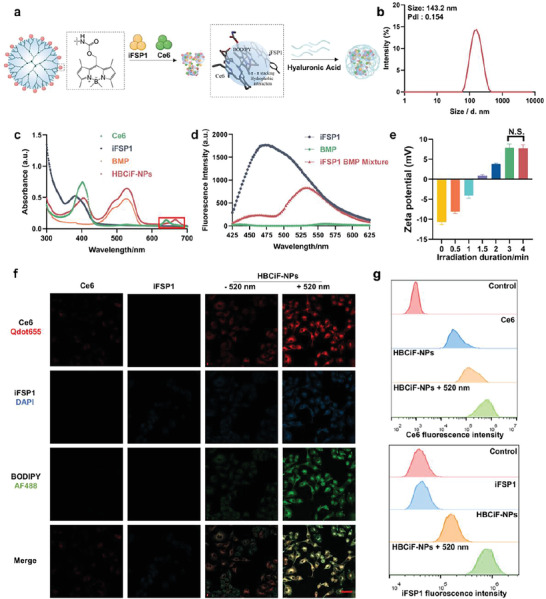
Fabrication/characterization of HBCiF‐NPs and light‐enhanced cellular uptake of Ce6 and iFSP1. a) Structure of BMP and preparation of HBCiF‐NPs. b) Size distribution of HBCiF‐NPs after preparation and centrifugation. c) UV‐vis spectra of Ce6, iFSP1, BMP, and HBCiF‐NPs. The red box highlights the red shift of Ce6 characteristic peak. d) Fluorescence resonance energy transfer between BODIPY and iFSP1, λex = 385 nm. e) Zeta potential change under light irradiation for different durations. (n = 3, mean ± SD). Confocal laser scanning microscopy (CLSM) images f) and flow cytometry analysis g) of living A549 cells incubated with free Ce6, free iFSP1, HBCiF‐NPs, and light irradiated HBCiF‐NPs, separately, for 4 h at 37 °C. Scale bar: 50 µm. Ce6, iFSP1, and BODIPY were visualized using Qdot655 (red), DAPI (blue), and AF488 channels (green), respectively. Light irradiation: Xe lamp, 520 nm, 25 mW cm−2, 3 min.