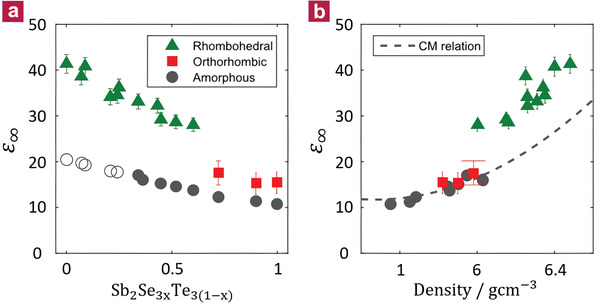
Figure 3.

Optical dielectric constant ε∞ along the pseudo‐binary line between Sb2Te3 and Sb2Se3. a) ε∞ as a function of stoichiometry. As for the GeTe1− x Se x system, the optical dielectric constant ε∞ of the crystalline phase is much higher than the corresponding amorphous state. The transition from the rhombohedral to the orthorhombic phase is accompanied by an abrupt drop in ε∞, indicative of a sudden breakdown of metavalent bonding. Samples with an Sb2Se3 content of less than 30% are already (partially) crystalline after deposition. Hence, values for ε∞ of these amorphous samples were extrapolated (open circles). b) The Clausius–Mossotti plot of ε∞ versus the mass density confirms that the rapid drop of ε∞ is not caused by a change of the mass density.
