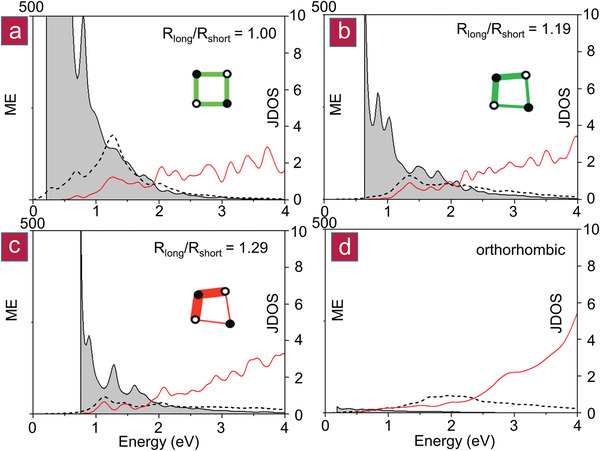
Figure 8.

Matrix element (ME) and joint density of states (JDOS). An increase in ES (i.e., in R long/R short) results in significant changes in the matrix element (i.e., in p‐orbital overlap) shown in gray, while the joint density (red curves) remains similar within the same crystal system. This figure shows clear differences between metavalent (a,b) and covalent (c,d) systems. ε2(ω) is shown as black dotted lines.
