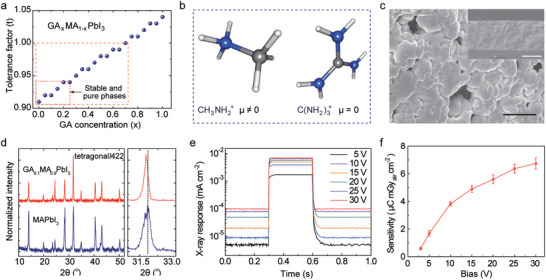
Figure 1.

Synthesis and characterizations of GA‐doped MAPbI3. a) The tolerance factor of GA x MA1−x PbI3 as a function of GA concentration. b) The molecular structures of MA and GA along with their net dipole moments (µ). The blue, gray, and white colored spheres represent nitrogen, carbon, and hydrogen, respectively. c) The SEM image of GA0.1MA0.9PbI3 film showing micrometer‐sized grains. Scale bar: 50 µm. The inset shows the cross‐sectional SEM image of the film. Scale bar: 200 µm. d) The XRD spectra of pure MAPbI3 and GA0.1MA0.9PbI3 films. e) Real‐time response of the diode‐configured X‐ray detector under X‐ray irradiation (tube voltage of 50 kV, and dose rate of 1.6 mGyair s−1 for 300 ms) with varying applied bias voltage. f) The sensitivities of the X‐ray detector as a function of bias voltage.
