Figure 4.

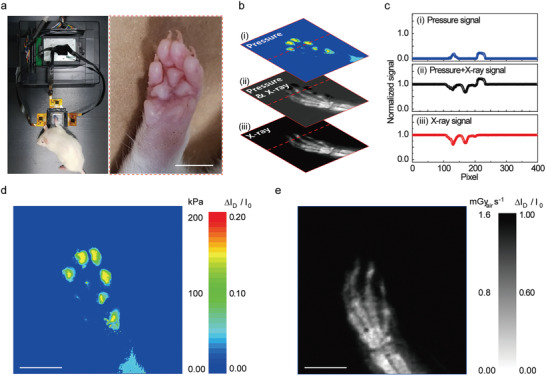
In vivo imaging of the X‐ray and the pressure. a) Photographs of the experimental set‐up (left) for in vivo radiography and pressure distribution imaging of the foot and an enlarged image of the rat's foot (right). Scale bar: 5 mm. b) Calibration process to distinguish the complex signals from visual (i.e., X‐rays) and tactile (i.e., pressure) information. i,iii) Contour plot of the pressure distribution, and X‐ray radiography, respectively. c) Normalized ∆I D/I 0 measured along the red dotted line in the contour plots in (b). d,e) Contour plots of the pressure distribution and anatomical structure of the rat's foot obtained by the multiplexed detector after the calibration process. The voltage of the X‐ray tube was kept at 50 kV with a dose rate of 1.6 mGyair s−1 for 500 ms (total X‐ray dose: 0.8 mGyair). Scale bars: 5 mm.
