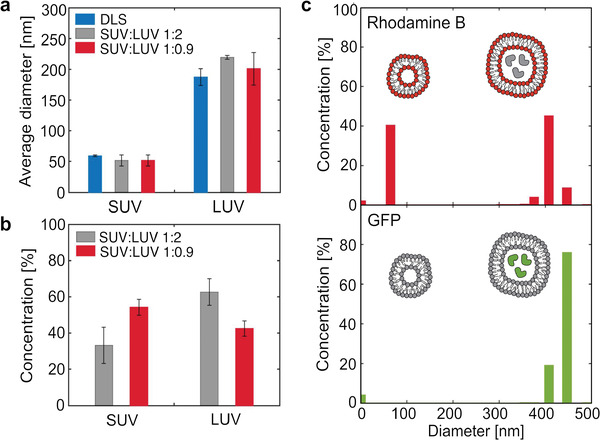
Figure 3.

Size, concentration, and biochemical analysis of mixtures of lipid vesicles by fluoMDS. a) Size of the small (SUV) and large (LUV) unilamellar lipid vesicles populations in polydisperse mixtures corresponding to 1:2 (grey) and 1:0.9 (red) SUV:LUV mass ratios evaluated by fluoMDS. In both mixtures the measured average diameters are consistent with the values measured in individual homogeneous populations by DLS (blue). b) fluoMDS correctly detects changes in the mass fractions of SUV and LUV in the two mixtures. c) fluoMDS can detect different components of a mixture in one single analysis by using complementary staining methods and leveraging multiwavelengths fluorescence detection. fluoMDS detects rhodamine‐labeled SUVs and LUVs when membrane Rhod‐PE is excited (red), while only the LUV subpopulation with encapsulated GFP when GFP is excited (green). Experiments (a)–(c) were performed in triplicates and a representative plot is shown for (c). Data (a),(b) represent means ± standard deviations.
