
Figure 5.
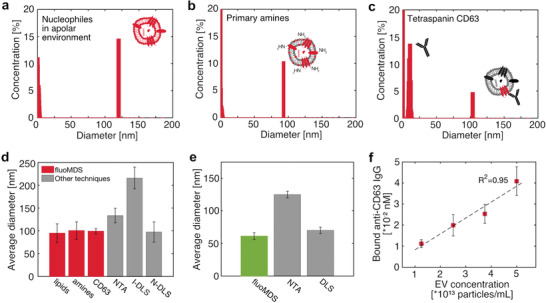
Single‐step immunoassay and fluoMDS multiparametric characterization of EVs extracted from human bone marrow stromal cells and microalgae and stained with unspecific and specific dyes. a–c) Particle populations detected by fluoMDS using different fluorophores: a) photoactivatable silicon‐rhodamine, which detects colocalized lipids and nucleophiles b) fluorescamine, which stains primary amines and c) anti‐CD63 immunoglobulin (IgG), which labels the EV surface‐marker tetraspanin CD63. In each panel the peaks in the low size ranges correspond to the free dye. d) Comparison between the particle average diameters measured by fluoMDS in (a)–(c) and the values measured by NTA in light‐scattering mode and from the DLS intensity (I‐DLS) and number (N‐DLS) based distributions (grey). e) Comparison between the average diameter of nanoalgosomes measured by fluoMDS (green) and the EV modes measured by NTA and DLS values reported in literature (grey).[ 24 ] For these measurements the nanoalgosomes were labelled with photoactivatable silicon‐rhodamine. f) Quantification of bound anti‐CD63 IgG in samples with different EV concentrations. The measured concentration of bound antibody scales linearly with the relative dilution, demonstrating that the device can accurately quantify the amount of CD63 in untreated samples. Experiments were performed in triplicates and data represent means ± standard deviations.