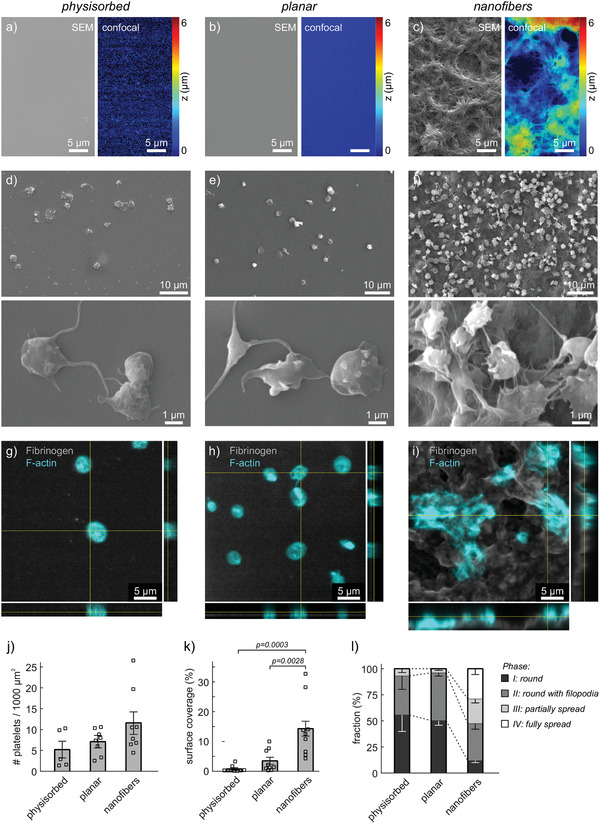
Figure 1.

Interactions of human platelet‐rich plasma (PRP) with fibrinogen scaffolds of different topographies. Samples comprised: a,d,g) physisorbed fibrinogen on glass coverslips; b,e,h) planar or c,f,i) nanofibrous fibrinogen scaffolds prepared by salt‐induced self‐assembly. a–c) Characterization of surface topography by scanning electron microscopy (SEM; left) or by confocal z‐stacks (color‐coded; right). Note that SEM and confocal images show different sample regions. d–l) PRP from citrated blood was incubated for 1 h at 37 °C on the surfaces before fixation and sample processing for imaging. d–f) Representative SEM images of fixed, dehydrated, and gold‐coated adherent platelets on the three different scaffolds. g–i) Representative confocal images and orthogonal views of adhered platelets on the three different scaffolds. Gray: fibrinogen stain. Cyan: phalloidin stain. j–l) Quantitative comparison of platelet interactions with the three different scaffolds with respect to j) number of adhered platelets, k) surface coverage by platelets, and l) spreading phase of platelets. Each data point in (j,k) represents one image. Bars and error bars show mean and standard error of the mean (s.e.m.) of replicates, respectively. For (j,k), differences between conditions were assessed by one‐way ANOVA with Tukey post hoc multiple comparison. Only p‐values smaller than 0.05 are displayed.
