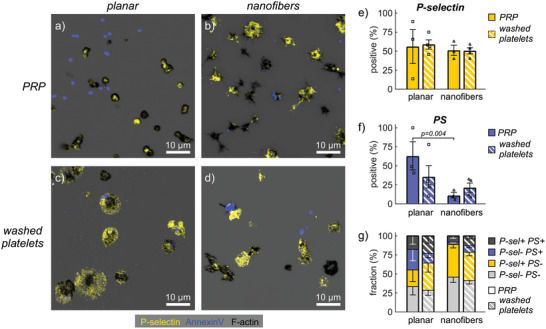
Figure 3.

Platelet activation markers on fibrinogen scaffolds of different topographies. a,c) Representative confocal slices on planar scaffolds or b,d) maximum intensity projections of z‐stacks on nanofibrous scaffolds of human platelets stained for phalloidin (black), P‐selectin (yellow), and Annexin‐V (blue). a,b) PRP or c,d) washed platelets were incubated for 45 min at 37 °C on the surfaces and then for 30 min in the presence of fluorescently labeled Annexin‐V before fixation and sample processing for imaging. e–g) Comparison of e) P‐selectin expression, f) PS exposure, and g) combinations thereof by scaffold topography and by absence/presence of plasma. Bars and error bars show mean and s.e.m. of replicates, respectively. For (e,f), differences between topographies were assessed by a ratio paired t‐test. Only p‐values smaller than 0.05 are displayed.
