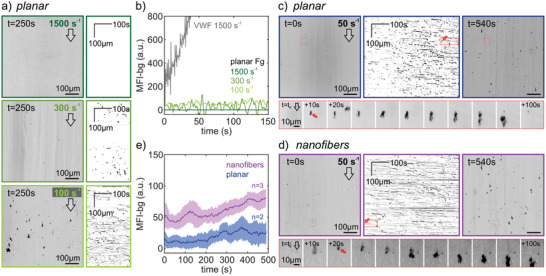
Figure 6.

Interactions of whole blood with planar or nanofiber fibrinogen scaffolds under flow. Scaffolds were integrated into a flow channel and whole blood was flown over the scaffolds using a defined flow rate. Platelets were visualized by the fluorescent DiOC6 membrane stain in epifluorescence at two frames per second. a) End frame (left, inverted colormap) and kymographs (right) of time‐lapse acquisitions at shear rates of 1500 s–1 (top), 300 s–1 (middle), or 100 s–1 (bottom). Direction of flow is indicated by an arrow. Kymographs were obtained by performing a maximum intensity projection of each frame onto the direction of flow (y‐axis) and plotting this over time (x‐axis). b) Background‐subtracted mean fluorescence intensity of platelet accumulation over time. Shown are the different shear rates (color coded) on planar fibrinogen scaffolds (see (a)). For comparison, platelet accumulation on a vWF‐coated surface is shown at arterial shear (gray). c,d) Kymographs with start and end frames (top) at a shear rate of 50 s–1 on c) planar or d) nanofiber fibrinogen scaffolds. The exemplary interaction event series (bottom) shown corresponds to the red arrow and boxed regions in the movie frames and kymographs. e) Comparison of platelet accumulation over time on planar (blue) or nanofiber (magenta) fibrinogen scaffolds. Shown are the mean and s.e.m. (40 s moving average) of the background‐subtracted mean fluorescence intensity of platelet accumulation over time.
