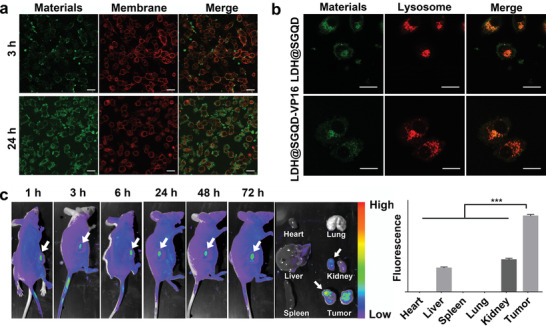
Figure 3.

CLSM images of HGC‐27 cells treated with LDH@SGQD‐VP16 (40 mg L–1) for 3 and 24 h at 488 nm. a) Cell membrane dyed by Dil at 543 nm. Scale: 20 µm. b) Lysosomal co‐localization of LDH@SGQD and LDH@SGQD‐VP16 at 24 h. Scale: 20 µm. In vivo fluorescence images at 1, 3, 6, 24, 48, and 72 h; organs (heart, liver, spleen, lung, kidney, and tumor) at 72 h, c) post intravenous injection with LDH@SGQD (0.1 mL, 9.2 g L–1) visualized at 475 nm and fluorescence quantification using ImageJ. The data in the figures represent the mean ± SD (n = 3). Significant differences: ***p < 0.001.
