. 2024 Oct 11;170(10):001504. doi: 10.1099/mic.0.001504

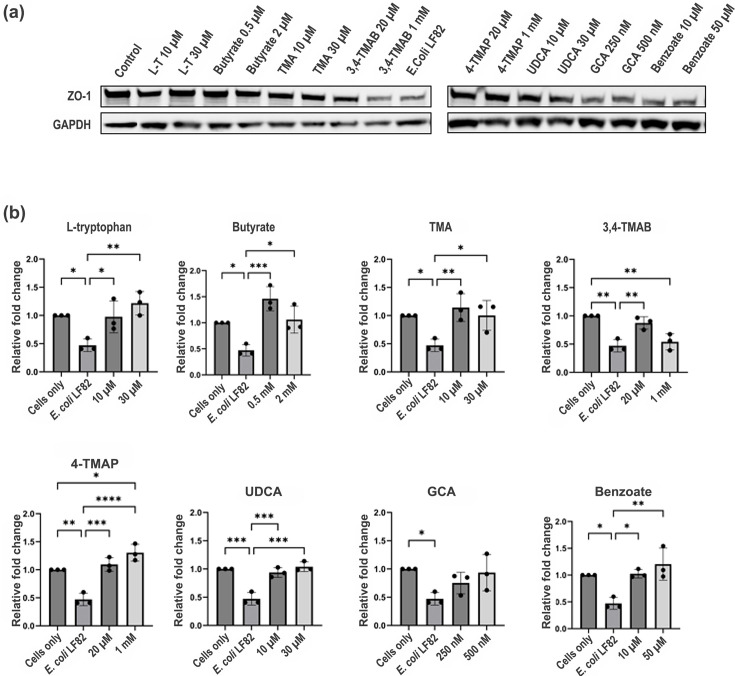
Fig. 1. HCT-8 exposure to metabolites rescues ZO-1 expression following infection with E. coli LF82. (a) The image shows ZO-1 and GAPDH expression (lanes 1–18) in HCT-8 cells. Cells were pre-treated for 48 h with metabolites at different concentrations as indicated, followed by infection with E. coli LF82 for 3 h. Lane 1 shows HCT-8 cells without pre-treatment or infection, and lane 10 shows infected HCT-8 without pre-treatment with any metabolite. (b) Graphs are labelled with the molecule that was used to pre-treat HCT-8 cells before infection and show the relative fold change in ZO-1 levels compared to control (HCT-8 cells without treatment or infection). The data shown represent three biological replicates, and ImageJ was used for analysis. One-way ANOVA was performed to test significance by comparing all conditions using GraphPad Prism. *P<0.05, **P<0.01, ***P<0.001 and ****P<0.0001 versus the control condition (infection without metabolites) were considered statistically significant.

Fig. 1.