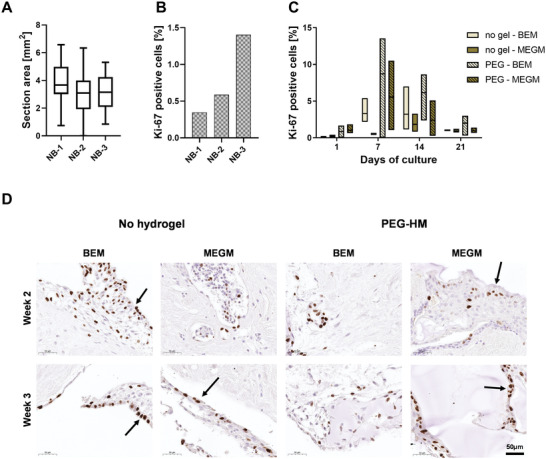
Figure 8.

Proliferation in normal human breast explant cultures. Proliferation in human breast explants at various time points and culture conditions was determined immunohistochemically by staining for Ki‐67. Positive cells were quantified for the whole explant region of triplicates of each culture condition and differences can be seen between the various time points and culture conditions. A) The size variation of the sections per donor (n = 46–51) in mm2. Boxplot whiskers are plotted by Tukey and the line shows the median. B) Percentage of positive cells for Ki‐67 of non‐cultured tissue (n = 3) at day 0 shown for all three normal breast donors. C) Quantification of Ki‐67 positive cells of donor NB‐1 tissue explants showing the proliferative activity over time from day 1 to day 21 and at various culture conditions. Box plot represents the three replicates for each tissue with line at median. D) Representative brightfield images of Ki‐67‐stained sections of NB‐1 are shown for week 2 and week 3. Sections were counterstained with hematoxylin. Scale bar: 50 µm.
