Figure 1.

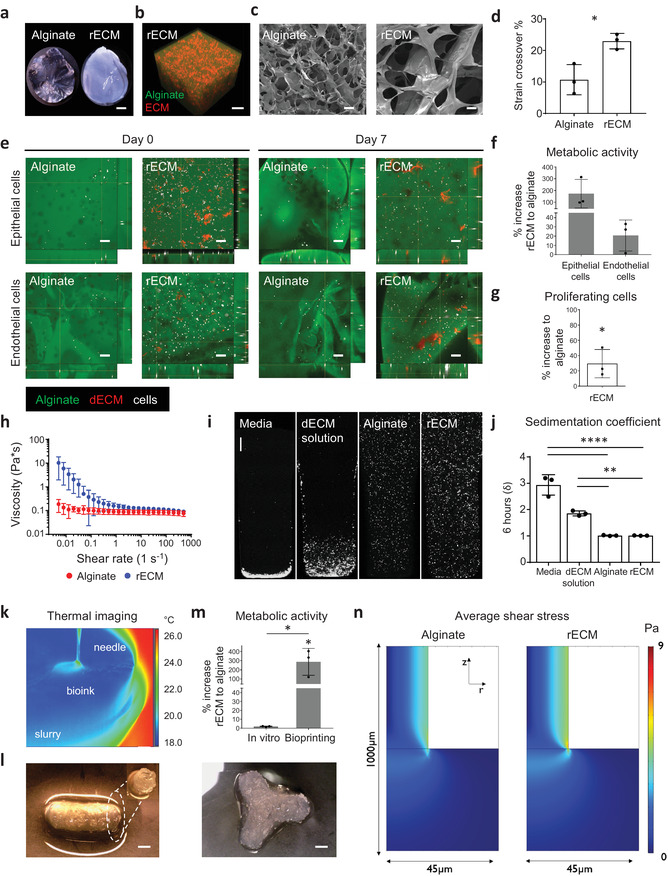
Characterization of rECM hybrid hydrogels. a) Picture of alginate and mouse rECM hydrogels. Scale bars: 1 mm. b) Alginate–fluorescein‐ and ECM–rhodamine‐modified rECM hydrogel showing the distribution of the alginate and ECM components within the hydrogel (see also Video S1 in the Supporting Information). Scale bar: 200 µm. c) SEM image of hydrogels. Scale bars: 50 µm. d) Strain crossover (%) between the storage and loss modulus in alginate hydrogels (2%) and rECM hydrogels (2% alginate, 5 mg mL−1 ECM) (n = 3 per group). e) Immunofluorescence images of murine lung epithelial MLE12 and endothelial bEnd3 (cells in white) in alginate–fluorescein (green) and ECM solution–rhodamine (red) modified rECM hydrogels on day 0 (day of seeding) and day 7. Scale bars: 100 µm f) Percent increase in metabolic activity of epithelial cells (MLE12) and endothelial (bEnd.3) cells in rECM hydrogels compared to alginate hydrogels on day 7 (n = 3 per group). g) Percent increase of EdU+ proliferating murine epithelial cells (MLE12) in rECM hydrogels compared to alginate hydrogels on day 5 (n = 3 per group). h) Oscillatory rheometry (n = 3 per group). i) Cell sedimentation confocal images and j) calculated sedimentation coefficient (δ) of A549 cells in DMEM–F12 cell culture media, alginate, mouse‐derived dECM and rECM solution for 6 h (n = 3 per group). Scale bar: 500 µm. k) Thermography of FRESH printing (see Video S2 in the Supporting Information). l) 3D bioprinted rECM hollow tube and branching structure (see Videos S3 and S4 in the Supporting Information). Scale bars: 2 mm. m) Metabolic activity (WST‐1 assay) on day 7 of seeded (in vitro) and 3D printed A549 cells in hydrogels (n = 3 per group). n) Average shear stress profiles of bioinks.
