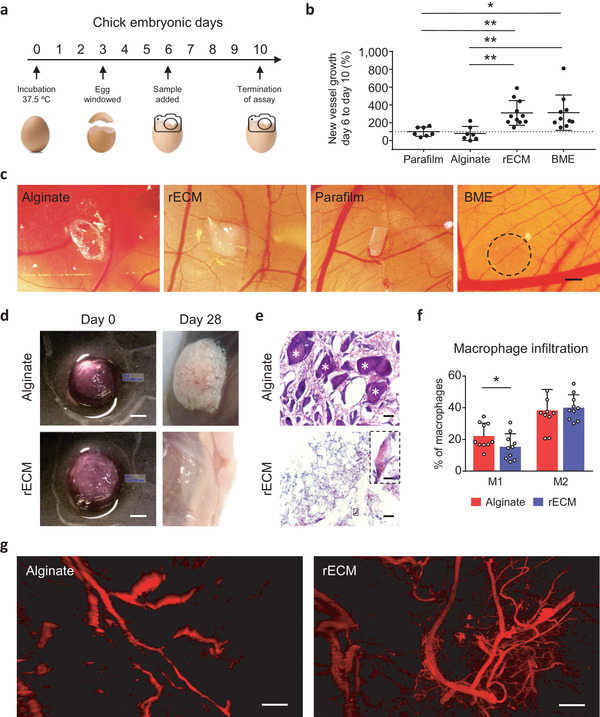
Figure 2.

Biocompatibility and angiogenic potential of rECM hydrogels. a) Overview of CAM procedure. b) Changes in blood vessel formation, i.e., blood vessels on day 10 compared to day 6 and normalized to parafilm (100%) for each sample group. (n = 7–10 per group). c) Images of BME (positive control), parafilm (negative control), rECM and alginate hydrogels on CAMs on day 10. Scale bar: 1 mm. d) 3D printed alginate and rECM hydrogels in disk shape before subcutaneous implantation and when explanted on day 28. Scale bars: 2 mm. e) H&E staining of subcutaneously implanted alginate and rECM hydrogels after 28 days. White asterisks * indicate large, non‐proteinaceous debris. Inset showing red blood cells in the inner lumen of a blood vessel. Scale bars: 50 and 10 µm (inner panel). f) Macrophage infiltration (defined by CD45+, CD11b+, and F4/80+) in implanted alginate and rECM hydrogels on day 7 (n = 10 animals per group). g) Light sheet microscopy images (maximum intensity projections) of explanted alginate and rECM hydrogels (day 28) after optical clearing, showing blood vessel infiltration visualized by autofluorescence (E x/ E m: 480/520 nm) (see Videos S4 and S5 in the Supporting Information). Scale bars: 250 µm.
