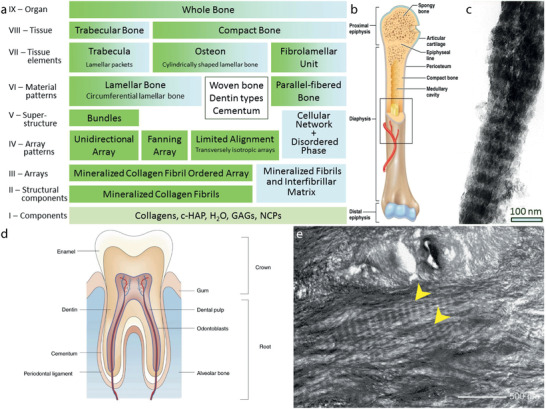
Figure 2.

Bone and tooth. a) The 9 hierarchical levels of bone as determined by Reznikov et al.[ 40 ] b) Schematic overview of human bone. c) TEM image of a mineralized collagen fibril in bone. Scale bar is 100 nm. d) Schematic overview of the human tooth. e) TEM image showing the microstructure of undamaged elephant dentin in a tusk, which is very similar to human dentin.[ 64b ] The mineralized collagen fibrils are indicated with an arrow. Scale bar is 500 nm. a,c) Reproduced with permission.[ 40 ] Copyright 2014, Elsevier. b) Reproduced with permission.[ 36 ] Copyright 2019, Taylor & Francis. d) Reproduced with permission.[ 61 ] Copyright 2019, Springer Nature. e) Reproduced with permission.[ 64b ] Copyright 2005, Elsevier.
