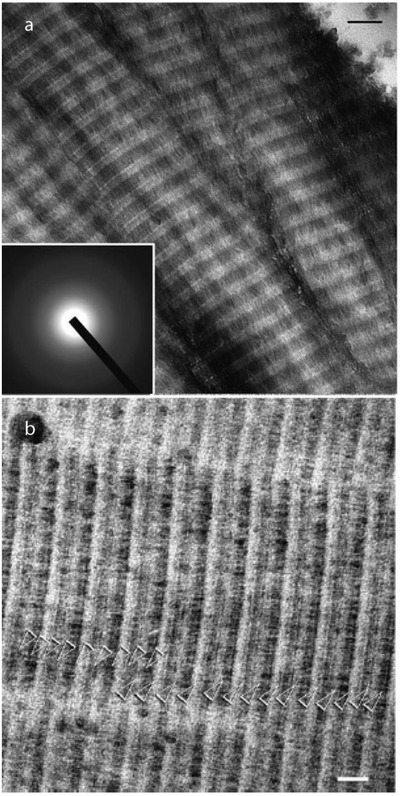
Figure 10.

Intrafibrillar silicification of different collagen type I. a) TEM micrograph showing that the mineral infiltrates the collagen fibers of a commercial collagen sponge replicates the typical banding pattern. Scale bar: 100 nm. b) Intrafibrillar mineralization of rat tendon fascicles. The white arrows indicate the continuity of the silica microfibrillar strands. Scale bar: 50 nm. Reproduced with permission.[ 151 ] Copyright 2011, Wiley‐VCH.
