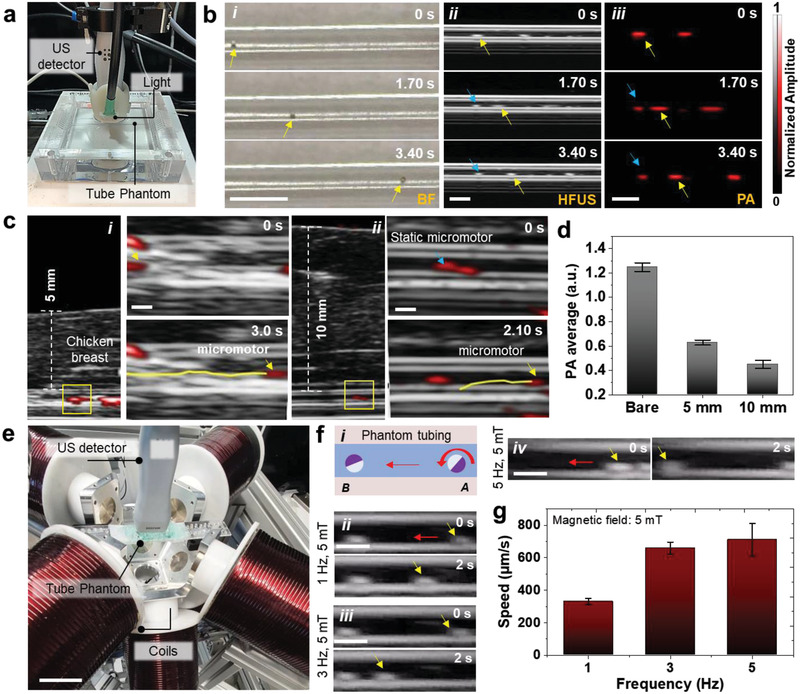
Figure 2.

Tracking of single micromotors in phantom and ex vivo chicken tissues. a) Phantom chamber with tubing immersed in a water bath with HFUS‐PA detector on top of it for real‐time tracking of moving micromotors. b) Time‐lapse images of a 100 µm moving micromotor in i) BF, ii) HFUS, and iii) PA modes. Yellow arrows show the single‐moving micromotors. Blue arrows point at static microstructures and are used as reference points. Scale bar: 1 mm. c) Time‐lapse images of a moving micromotor below i) 5 mm and ii) 10 mm breast chicken tissue. Scale bar: 500 µm. d) PA signal amplitude of single micromotors with comparable ROIs below 5 and 10 mm thick tissue, which decreases with increased penetration depth. e) Integrated imaging and magnetic actuation setup. Scale bar: 4 cm. f,i) Schematic and ii–iv) controlled actuation of single moving micromotor inside the phantom tubing at 5 mT and varying frequencies (1, 3, and 5 Hz). Scale bar: 1 mm. g) The relationship between the micromotor speed and the applied frequency at a constant magnetic field strength. The magnetic field value was set to 5 mT and the frequency was adjusted (from 1 to 5 Hz). Each error bar denotes the ±SD from three replicates (n = 3).
