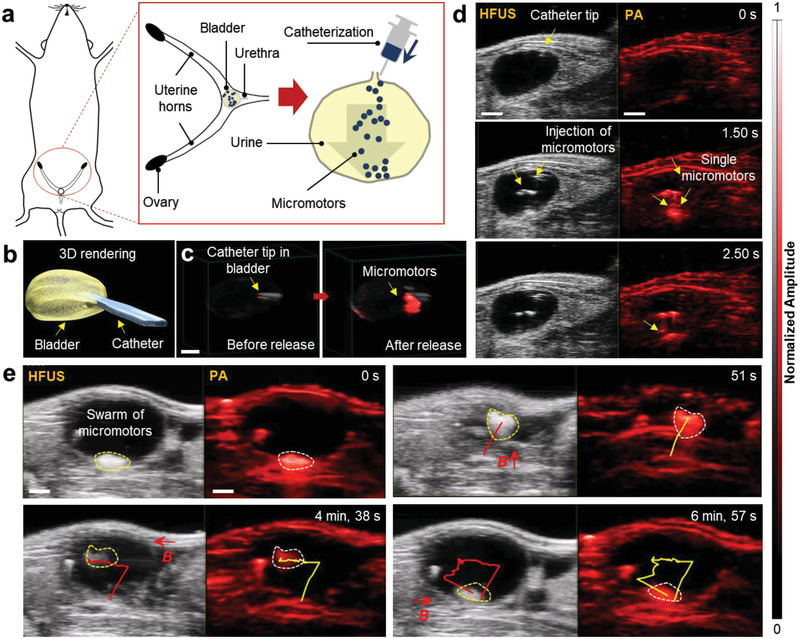
Figure 3.

HFUS and PA imaging of a single and swarm of micromotors swimming inside a mouse bladder. a) Schematic showing the position of the bladder. b) 3D reconstruction of the bladder with the inserted catheter, after performing the catheterization via real‐time US feedback. c) HFUS and PA overlaid images showing the location of the catheter tip, before and after releasing the micromotors. d) Dual HFUS and PA time‐lapse images of swimming and free‐falling micromotors for 2.50 s. The micromotors migrate downward after being released from the catheter tip individually and then accumulate at the bottom surface. Scale bar, 1 mm. e) A swarm of swimming micromotors under the actuation of a magnetic field gradient of ≈220 mT cm−1. The dimension of this moving cluster was ≈2–3 mm wide. Scale bar: 2 mm.
